 Web Server Statistics for [Zachary A Horn dot Com] Web Server Statistics for [Zachary A Horn dot Com]
(Go To: Top: General Summary: Monthly Report: Daily Summary: Hourly Summary: Domain Report: Organisation Report: Host Failure Report: Referrer Report: Referring Site Report: Browser Summary: Operating System Report: Status Code Report: File Size Report: File Type Report: Directory Report: Failure Report: Request Report)
This report contains overall statistics.
(Figures in parentheses refer to the 7-day period ending 18-Aug-2025 03:39).
Successful requests: 3,129 (641)
Average successful requests per day: 89 (91)
Successful requests for pages: 1,462 (303)
Average successful requests for pages per day: 41 (43)
Failed requests: 5,628 (606)
Distinct files requested: 58 (55)
Distinct hosts served: 1,092 (299)
Data transferred: 15.85 megabytes (6.84 megabytes)
Average data transferred per day: 464.64 kilobytes (0.98 megabytes)
(Go To: Top: General Summary: Monthly Report: Daily Summary: Hourly Summary: Domain Report: Organisation Report: Host Failure Report: Referrer Report: Referring Site Report: Browser Summary: Operating System Report: Status Code Report: File Size Report: File Type Report: Directory Report: Failure Report: Request Report)
This report lists the activity in each month.
Each unit ( ) represents 20 requests for pages or part thereof.
month: reqs: pages: --------: ----: -----: Jul 2025: 1534: 735:Busiest month: Jul 2025 (735 requests for pages).
(Go To: Top: General Summary: Monthly Report: Daily Summary: Hourly Summary: Domain Report: Organisation Report: Host Failure Report: Referrer Report: Referring Site Report: Browser Summary: Operating System Report: Status Code Report: File Size Report: File Type Report: Directory Report: Failure Report: Request Report)
This report lists the total activity for each day of the week, summed over all the weeks in the report.
Each unit () represents 5 requests for pages or part thereof.
day: reqs: pages: ---: ----: -----: Sun: 490: 205:Wed: 478: 230:
Thu: 464: 234:
(Go To: Top: General Summary: Monthly Report: Daily Summary: Hourly Summary: Domain Report: Organisation Report: Host Failure Report: Referrer Report: Referring Site Report: Browser Summary: Operating System Report: Status Code Report: File Size Report: File Type Report: Directory Report: Failure Report: Request Report)
This report lists the total activity for each hour of the day, summed over all the days in the report.
Each unit () represents 2 requests for pages or part thereof.
hour: reqs: pages: ----: ----: -----: 0: 117: 56:1: 115: 56:
9: 127: 73:
(Go To: Top: General Summary: Monthly Report: Daily Summary: Hourly Summary: Domain Report: Organisation Report: Host Failure Report: Referrer Report: Referring Site Report: Browser Summary: Operating System Report: Status Code Report: File Size Report: File Type Report: Directory Report: Failure Report: Request Report)
This report lists the countries of the computers which requested files.
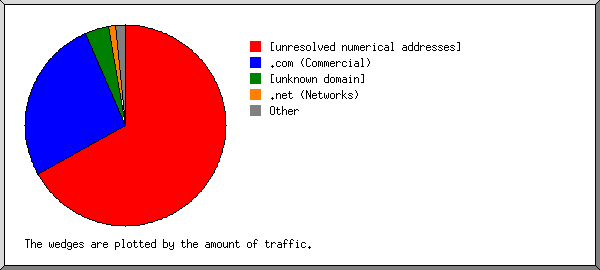
Listing domains, sorted by the amount of traffic.
reqs: %bytes: domain
----: ------: ------
1383: 84.70%: [unresolved numerical addresses]
1154:  7.75%: .com (Commercial)
 357:  3.23%: .net (Networks)
  99:  1.41%: [unknown domain]
  33:  1.30%: .de (Germany)
  21:  0.60%: .nl (Netherlands)
  22:  0.29%: .org (Non Profit Making Organisations)
   5:  0.14%: .se (Sweden)
   4:  0.12%: .arpa (Arpanet)
  18:  0.10%: .cz (Czech Republic)
   8:  0.08%: .ru (Russia)
  10:  0.08%: .cn (China)
   2:  0.06%: [domain not given]
   3:  0.06%: .lt (Lithuania)
   3:  0.03%: .io (British Indian Ocean Territory)
   1:  0.02%: .sh (Saint Helena)
   2:  0.02%: .br (Brazil)
   2:  0.01%: .ua (Ukraine)
   1:  0.01%: .cl (Chile)
   1:  0.01%: .pk (Pakistan)
(Go To: Top: General Summary: Monthly Report: Daily Summary: Hourly Summary: Domain Report: Organisation Report: Host Failure Report: Referrer Report: Referring Site Report: Browser Summary: Operating System Report: Status Code Report: File Size Report: File Type Report: Directory Report: Failure Report: Request Report)
This report lists the organisations of the computers which requested files.
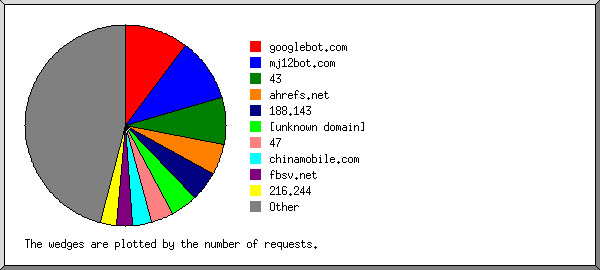
Listing the top 20 organisations by the number of requests, sorted by the number of requests.
reqs: %bytes: organisation
----: ------: ------------
 599:  3.42%: mj12bot.com
 281:  2.14%: ahrefs.net
 252:  1.97%: 43
 230:  1.71%: 216.73
 191:  0.81%: googlebot.com
  99:  1.41%: [unknown domain]
  98: 69.70%: 188.143
  82:  0.52%: petalsearch.com
  59:  0.28%: googleusercontent.com
  42:  0.55%: 216.244
  41:  0.36%: 20
  39:  0.38%: 124
  39:  0.31%: 170.106
  35:  0.20%: semrush.com
  33:  0.64%: linodeusercontent.com
  32:  0.13%: fbsv.net
  32:  0.18%: amazonaws.com
  31:  0.24%: 49
  30:  0.09%: 4
  27:  0.19%: seranking.com
 857: 14.75%: [not listed: 204 organisations]
(Go To: Top: General Summary: Monthly Report: Daily Summary: Hourly Summary: Domain Report: Organisation Report: Host Failure Report: Referrer Report: Referring Site Report: Browser Summary: Operating System Report: Status Code Report: File Size Report: File Type Report: Directory Report: Failure Report: Request Report)
This report lists the computers which encountered failed requests.
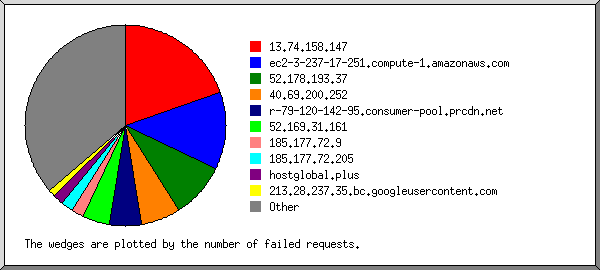
Listing the top 20 hosts by the number of failed requests, sorted by the number of failed requests.
reqs: host
----: ----
 762: 185.177.72.7
 710: 52.169.14.74
 405: unn-149-102-254-25.datapacket.com
 362: 185.177.72.115
 347: 40.113.83.83
 262: 40.113.91.248
 254: 138.91.49.60
 230: 52.169.127.96
 192: 40.85.132.143
 192: 13.94.102.115
 186: 40.113.83.128
 174: 135.220.170.25
 119: 52.169.252.32
  88: 52.164.125.106
  88: 40.113.89.45
  88: 13.70.199.2
  79: 40.113.89.18
  79: 185.177.72.210
  67: 185.177.72.111
  53: 40.69.5.65
 891: [not listed: 172 hosts]
(Go To: Top: General Summary: Monthly Report: Daily Summary: Hourly Summary: Domain Report: Organisation Report: Host Failure Report: Referrer Report: Referring Site Report: Browser Summary: Operating System Report: Status Code Report: File Size Report: File Type Report: Directory Report: Failure Report: Request Report)
This report lists the referrers (where people followed links from, or pages which included this site's images).
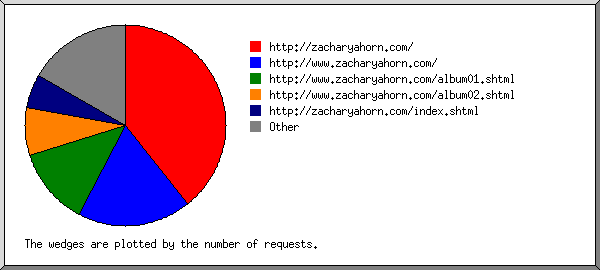
Listing referring URLs with at least 20 requests, sorted by the number of requests.
reqs: URL
----: ---
  98: http://www.zacharyahorn.com/
  79: http://zacharyahorn.com/
  27: http://zacharyahorn.com/album01.shtml
  22: https://www.google.com/
  21: http://zacharyahorn.com/index.shtml
  46: [not listed: 12 URLs]
(Go To: Top: General Summary: Monthly Report: Daily Summary: Hourly Summary: Domain Report: Organisation Report: Host Failure Report: Referrer Report: Referring Site Report: Browser Summary: Operating System Report: Status Code Report: File Size Report: File Type Report: Directory Report: Failure Report: Request Report)
This report lists which servers people followed links from.
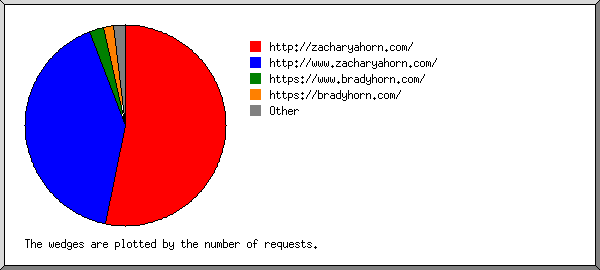
Listing referring sites, sorted by the number of requests.
reqs: site
----: ----
 147: http://zacharyahorn.com/
 116: http://www.zacharyahorn.com/
  22: https://www.google.com/
   3: https://www.bradyhorn.com/
   2: https://bradyhorn.com/
   1: https://www.google.co.jp/
   1: https://135.237.223.127:60001/
   1: http://www.etufac.online/
(Go To: Top: General Summary: Monthly Report: Daily Summary: Hourly Summary: Domain Report: Organisation Report: Host Failure Report: Referrer Report: Referring Site Report: Browser Summary: Operating System Report: Status Code Report: File Size Report: File Type Report: Directory Report: Failure Report: Request Report)
This report lists the vendors of visitors' browsers.
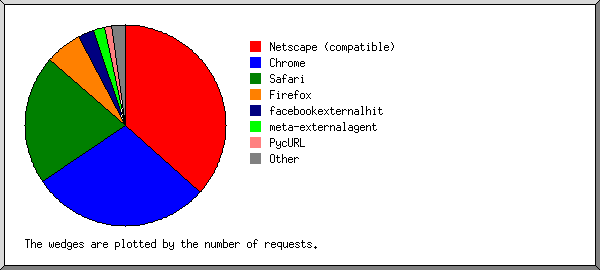
Listing the top 20 browsers by the number of requests, sorted by the number of requests.
reqs: browser
----: -------
1563: Netscape (compatible)
 670: Safari
 561:   Safari/604
  69:   Safari/537
  35:   Safari/605
   4:   Safari/601
   1:   Safari/534
 585: Chrome
  75:   Chrome/78
  74:   Chrome/50
  39:   Chrome/137
  57:   Chrome/81
  28:   Chrome/74
  18:   Chrome/138
  11:   Chrome/130
  10:   Chrome/131
   8:   Chrome/114
  33:   Chrome/119
  15:   Chrome/80
  16:   Chrome/134
   9:   Chrome/91
   9:   Chrome/121
   8:   Chrome/120
   6:   Chrome/71
   9:   Chrome/72
   6:   Chrome/113
   5:   Chrome/57
   7:   Chrome/63
 137: Firefox
 102:   Firefox/126
   4:   Firefox/137
   3:   Firefox/111
   4:   Firefox/123
   2:   Firefox/3
   2:   Firefox/122
   2:   Firefox/127
   6:   Firefox/117
   3:   Firefox/136
   1:   Firefox/63
   1:   Firefox/55
   1:   Firefox/73
   1:   Firefox/67
   1:   Firefox/2
   1:   Firefox/134
   1:   Firefox/125
   1:   Firefox/128
   1:   Firefox/139
  34: facebookexternalhit
  34:   facebookexternalhit/1
  33: PycURL
  33:   PycURL/7
  20: meta-externalagent
  20:   meta-externalagent/1
  10: curl
  10:   curl/7
   7: CCBot
   7:   CCBot/2
   6: Hello from Palo Alto Networks, find out more about our scans in https:
   6:   Hello from Palo Alto Networks, find out more about our scans in https://docs-cortex
   5: Python
   5:   Python/3
   5: python-requests
   5:   python-requests/2
   5: Baiduspider
   4:   Baiduspider/2
   5: HawaiiBot
   5: Mozilla
   5: DnBCrawler-Analytics
   4: Go-http-client
   4:   Go-http-client/1
   4: CheckMarkNetwork
   4:   CheckMarkNetwork/1
   3: 2ip bot
   3:   2ip bot/1
   2: python-httpx
   2:   python-httpx/0
  11: [not listed: 7 browsers]
(Go To: Top: General Summary: Monthly Report: Daily Summary: Hourly Summary: Domain Report: Organisation Report: Host Failure Report: Referrer Report: Referring Site Report: Browser Summary: Operating System Report: Status Code Report: File Size Report: File Type Report: Directory Report: Failure Report: Request Report)
This report lists the operating systems used by visitors.
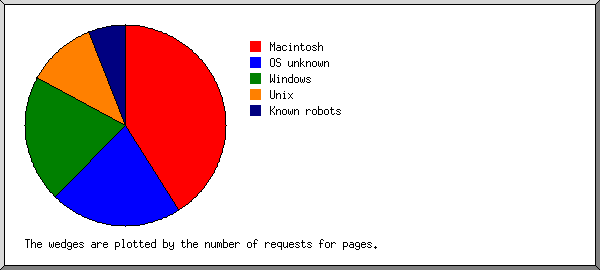
Listing operating systems, sorted by the number of requests for pages.
no.: reqs: pages: OS
---: ----: -----: --
  1:  634:   554: Macintosh
  2: 1393:   410: OS unknown
  3:  286:   205: Windows
   :  213:   134:   Windows NT
   :   68:    66:   Windows 7
   :    4:     4:   Unknown Windows
   :    1:     1:   Windows XP
  4:  409:   188: Unix
   :  405:   185:   Linux
   :    4:     3:   Other Unix
  5:  397:    95: Known robots
(Go To: Top: General Summary: Monthly Report: Daily Summary: Hourly Summary: Domain Report: Organisation Report: Host Failure Report: Referrer Report: Referring Site Report: Browser Summary: Operating System Report: Status Code Report: File Size Report: File Type Report: Directory Report: Failure Report: Request Report)
This report lists the HTTP status codes of all requests.
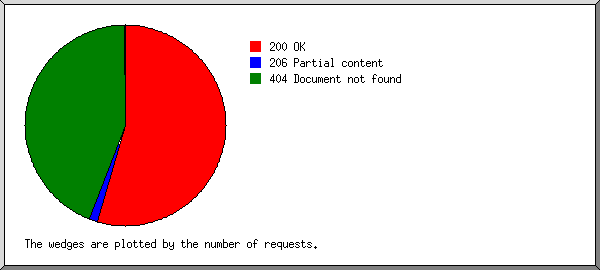
Listing status codes, sorted numerically.
reqs: status code
----: -----------
3093: 200 OK
  34: 206 Partial content
   2: 304 Not modified since last retrieval
   6: 403 Access forbidden
5622: 404 Document not found
(Go To: Top: General Summary: Monthly Report: Daily Summary: Hourly Summary: Domain Report: Organisation Report: Host Failure Report: Referrer Report: Referring Site Report: Browser Summary: Operating System Report: Status Code Report: File Size Report: File Type Report: Directory Report: Failure Report: Request Report)
This report lists the sizes of files.
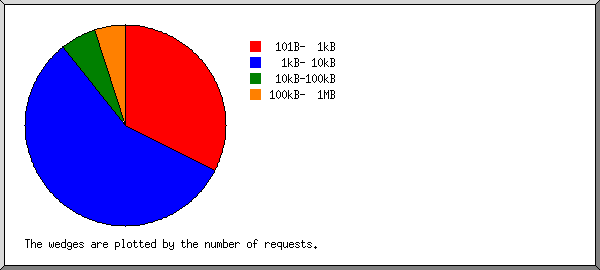
       size: reqs: %bytes:
-----------: ----: ------:
          0:    1:       :
   1B-  10B:    0:       :
  11B- 100B:    0:       :
 101B-  1kB: 1036:  3.51%:
  1kB- 10kB: 1992: 20.40%:
 10kB-100kB:   23: 12.11%:
100kB-  1MB:   77: 63.98%:
(Go To: Top: General Summary: Monthly Report: Daily Summary: Hourly Summary: Domain Report: Organisation Report: Host Failure Report: Referrer Report: Referring Site Report: Browser Summary: Operating System Report: Status Code Report: File Size Report: File Type Report: Directory Report: Failure Report: Request Report)
This report lists the extensions of files.
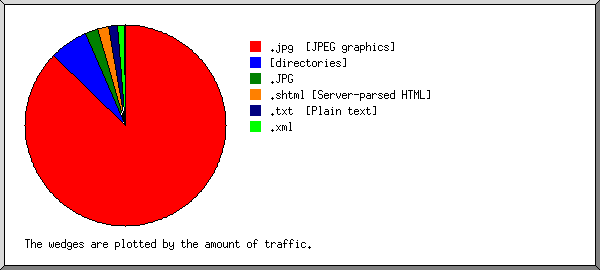
Listing extensions with at least 0.1% of the traffic, sorted by the amount of traffic.
reqs: %bytes: extension
----: ------: ---------
  99: 74.56%: .jpg  [JPEG graphics]
1440: 13.05%: [directories]
 259:  3.98%: .shtml [Server-parsed HTML]
 329:  3.41%: .xml
 941:  3.24%: .txt  [Plain text]
   2:  1.52%: .JPG
  37:  0.16%: .css  [Cascading Style Sheets]
  22:  0.07%: [not listed: 1 extension]
(Go To: Top: General Summary: Monthly Report: Daily Summary: Hourly Summary: Domain Report: Organisation Report: Host Failure Report: Referrer Report: Referring Site Report: Browser Summary: Operating System Report: Status Code Report: File Size Report: File Type Report: Directory Report: Failure Report: Request Report)
This report lists the directories from which files were requested. (The figures for each directory include all of its subdirectories.)
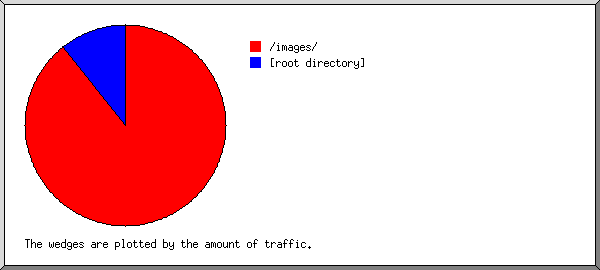
Listing directories with at least 0.01% of the traffic, sorted by the amount of traffic.
reqs: %bytes: directory
----: ------: ---------
 103: 76.13%: /images/
3026: 23.87%: [root directory]
(Go To: Top: General Summary: Monthly Report: Daily Summary: Hourly Summary: Domain Report: Organisation Report: Host Failure Report: Referrer Report: Referring Site Report: Browser Summary: Operating System Report: Status Code Report: File Size Report: File Type Report: Directory Report: Failure Report: Request Report)
This report lists the files that caused failures, for example files not found.
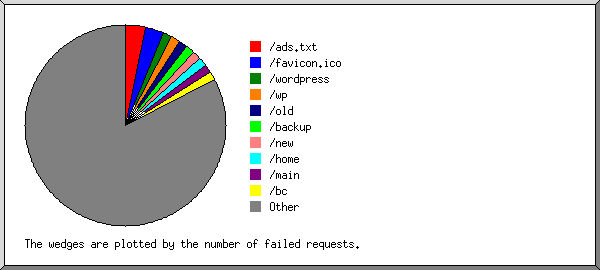
Listing the top 30 files by the number of failed requests, sorted by the number of failed requests.
reqs: file
----: ----
  75: /ads.txt
  55: /favicon.ico
  26: /new
  26: /wp
  26: /old
  26: /wordpress
  25: /main
  22: /bc
  22: /bk
  22: /home
  22: /backup
  21: /autoload_classmap.php
  20: /edit.php
  19: /admin.php
  19: /radio.php
  19: /about.php
  19: /xmlrpc.php
  19: /info.php
  18: /classwithtostring.php
  18: /.env
  18: /chosen.php
  18: /dropdown.php
  17: /wp.php
  17: /wp-login.php
  16: /simple.php
  16: /file.php
  15: /as.php
  15: /k.php
  14: /install.php
  14: /wp-admin/
4949: [not listed: 2,308 files]
(Go To: Top: General Summary: Monthly Report: Daily Summary: Hourly Summary: Domain Report: Organisation Report: Host Failure Report: Referrer Report: Referring Site Report: Browser Summary: Operating System Report: Status Code Report: File Size Report: File Type Report: Directory Report: Failure Report: Request Report)
This report lists the files on the site.
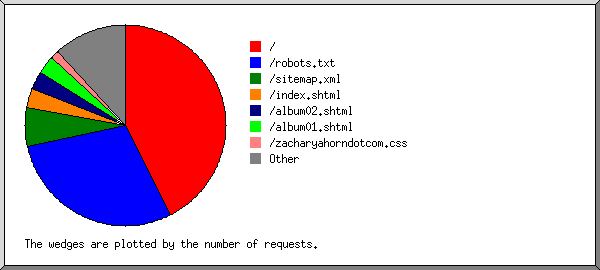
Listing files with at least 20 requests, sorted by the number of requests.
reqs: %bytes:       last time: file
----: ------: ---------------: ----
1438: 13.01%: 17/Aug/25 23:23: /
 941:  3.24%: 17/Aug/25 21:41: /robots.txt
 322:  3.39%: 17/Aug/25 19:47: /sitemap.xml
  92:  0.95%: 17/Aug/25 23:24: /index.shtml
  90:  1.76%: 17/Aug/25 23:24: /album01.shtml
  77:  1.28%: 17/Aug/25 23:25: /album02.shtml
  37:  0.16%: 17/Aug/25 19:42: /zacharyahorndotcom.css
 132: 76.22%: 17/Aug/25 23:25: [not listed: 50 files]
(Go To: Top: General Summary: Monthly Report: Daily Summary: Hourly Summary: Domain Report: Organisation Report: Host Failure Report: Referrer Report: Referring Site Report: Browser Summary: Operating System Report: Status Code Report: File Size Report: File Type Report: Directory Report: Failure Report: Request Report)

