 Web Server Statistics for [Brady Horn dot Com] Web Server Statistics for [Brady Horn dot Com]
(Go To: Top: General Summary: Monthly Report: Daily Summary: Hourly Summary: Domain Report: Organisation Report: Search Word Report: Operating System Report: Status Code Report: File Size Report: File Type Report: Directory Report: Request Report)
This report contains overall statistics.
(Figures in parentheses refer to the 7-day period ending
21-Jan-2003 15:57).
Successful requests: 337 (332)
Average successful requests per day: 51 (47)
Successful requests for pages: 49 (47)
Average successful requests for pages per day: 7 (6)
Failed requests: 55 (53)
Distinct files requested: 118 (118)
Distinct hosts served: 30 (28)
Data transferred: 10.361 megabytes (10.250 megabytes)
Average data transferred per day: 1.592 megabytes (1.464 megabytes)
(Go To: Top: General Summary: Monthly Report: Daily Summary: Hourly Summary: Domain Report: Organisation Report: Search Word Report: Operating System Report: Status Code Report: File Size Report: File Type Report: Directory Report: Request Report)
This report lists the activity in each month.
Each unit ( ) represents 2 requests
for pages or part thereof.
) represents 2 requests
for pages or part thereof.
   month: reqs: pages:
--------: ----: -----:
Jan 2003:  337:    49:
Busiest month: Jan 2003 (49 requests for pages).
(Go To: Top: General Summary: Monthly Report: Daily Summary: Hourly Summary: Domain Report: Organisation Report: Search Word Report: Operating System Report: Status Code Report: File Size Report: File Type Report: Directory Report: Request Report)
This report lists the total activity for each day of the week, summed over all the weeks in the report.
Each unit () represents 1 request
for a page.
day: reqs: pages: ---: ----: -----: Sun: 32: 4:Mon: 99: 9:
Thu: 120: 19:
(Go To: Top: General Summary: Monthly Report: Daily Summary: Hourly Summary: Domain Report: Organisation Report: Search Word Report: Operating System Report: Status Code Report: File Size Report: File Type Report: Directory Report: Request Report)
This report lists the total activity for each hour of the day, summed over all the days in the report.
Each unit () represents 1 request
for a page.
hour: reqs: pages: ----: ----: -----: 0: 0: 0: 1: 1: 0: 2: 0: 0: 3: 1: 0: 4: 4: 2:5: 1: 0: 6: 2: 0: 7: 4: 1:
(Go To: Top: General Summary: Monthly Report: Daily Summary: Hourly Summary: Domain Report: Organisation Report: Search Word Report: Operating System Report: Status Code Report: File Size Report: File Type Report: Directory Report: Request Report)
This report lists the countries of the computers which requested files.
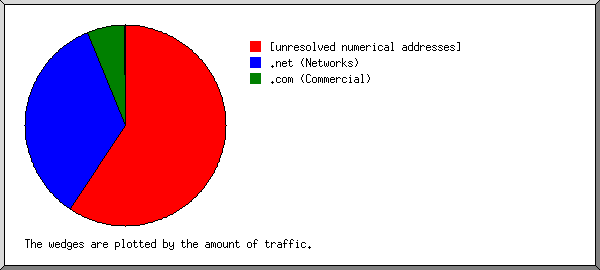
Listing domains, sorted by the amount of traffic.
reqs: %bytes: domain
----: ------: ------
 110: 59.16%: [unresolved numerical addresses]
 182: 34.70%: .net (Networks)
  41:  6.02%: .com (Commercial)
   1:  0.04%: .us (United States)
   1:  0.04%: .sc (Seychelles)
   1:  0.04%: .edu (USA Higher Education)
   1:       : .ch (Switzerland)
(Go To: Top: General Summary: Monthly Report: Daily Summary: Hourly Summary: Domain Report: Organisation Report: Search Word Report: Operating System Report: Status Code Report: File Size Report: File Type Report: Directory Report: Request Report)
This report lists the organisations of the computers which requested files.
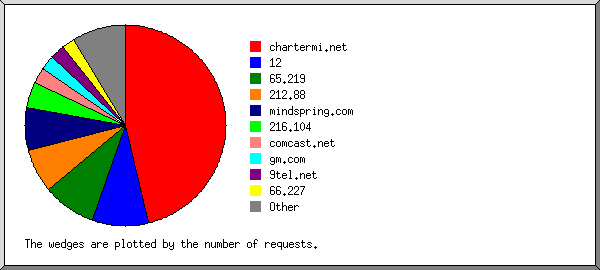
Listing the top 20 organisations by the number of requests, sorted by the number of requests.
reqs: %bytes: organisation
----: ------: ------------
 156: 28.60%: chartermi.net
  30:  3.57%: 12
  29: 50.21%: 65.219
  24:  1.62%: 212.88
  23:  1.30%: mindspring.com
  14:  1.56%: 216.104
   9:  2.74%: comcast.net
   8:  2.59%: gm.com
   8:  1.24%: 9tel.net
   7:  1.10%: 66.227
   4:  1.06%: 198.208
   4:  1.06%: tds.net
   4:  1.05%: aol.com
   4:  1.06%: rr.com
   2:       : arcor-ip.net
   2:  1.02%: fastsearch.net
   1:  0.04%: jcisd.k12.mi.us
   1:  0.04%: 209.241
   1:  0.04%: msu.edu
   1:       : netcraft.com
   5:  0.09%: [not listed: 5 organisations]
(Go To: Top: General Summary: Monthly Report: Daily Summary: Hourly Summary: Domain Report: Organisation Report: Search Word Report: Operating System Report: Status Code Report: File Size Report: File Type Report: Directory Report: Request Report)
This report lists which words people used in search engines to find the site.

Listing query words, sorted by the number of requests.
reqs: search term
----: -----------
   1: michigan
   1: bradyhorn
   1: snorkel
   1: tecumseh
(Go To: Top: General Summary: Monthly Report: Daily Summary: Hourly Summary: Domain Report: Organisation Report: Search Word Report: Operating System Report: Status Code Report: File Size Report: File Type Report: Directory Report: Request Report)
This report lists the operating systems used by visitors.
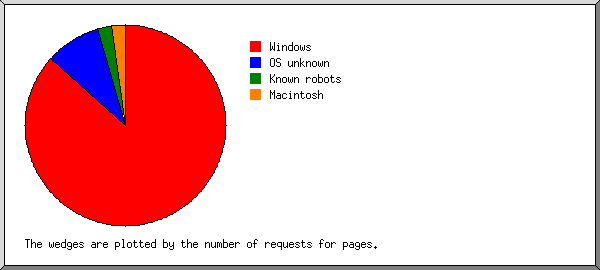
Listing operating systems, sorted by the number of requests for pages.
no.: reqs: pages: OS
---: ----: -----: --
  1:  308:    39: Windows
   :  214:    25:   Windows 98
   :   41:     6:   Windows 2000
   :   39:     4:   Windows XP
   :    5:     2:   Windows NT
   :    8:     1:   Windows ME
   :    1:     1:   Windows 95
  2:    4:     4: OS unknown
  3:    2:     1: Known robots
  4:    4:     1: Macintosh
   :    4:     1:   Macintosh PowerPC
(Go To: Top: General Summary: Monthly Report: Daily Summary: Hourly Summary: Domain Report: Organisation Report: Search Word Report: Operating System Report: Status Code Report: File Size Report: File Type Report: Directory Report: Request Report)
This report lists the HTTP status codes of all requests.
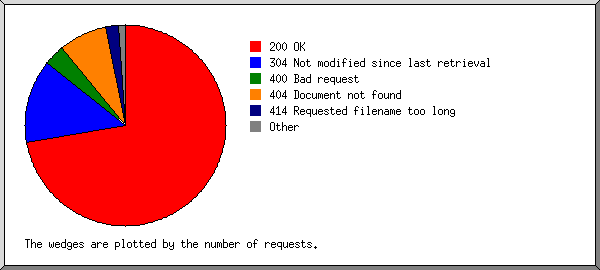
Listing status codes, sorted numerically.
reqs: status code
----: -----------
 283: 200 OK
   1: 206 Partial content
  53: 304 Not modified since last retrieval
  13: 400 Bad request
  31: 404 Document not found
   3: 405 Method not allowed
   8: 414 Requested filename too long
(Go To: Top: General Summary: Monthly Report: Daily Summary: Hourly Summary: Domain Report: Organisation Report: Search Word Report: Operating System Report: Status Code Report: File Size Report: File Type Report: Directory Report: Request Report)
This report lists the sizes of files.
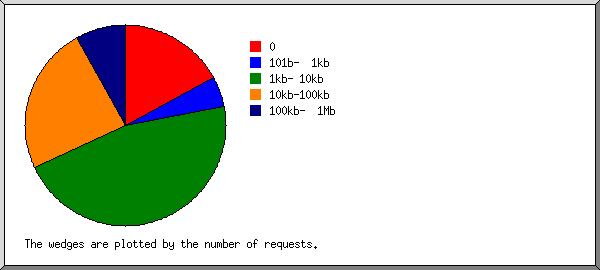
       size: reqs: %bytes:
-----------: ----: ------:
          0:   58:       :
   1b-  10b:    0:       :
  11b- 100b:    0:       :
 101b-  1kb:   16:  0.14%:
  1kb- 10kb:  155:  8.25%:
 10kb-100kb:   81: 32.26%:
100kb-  1Mb:   27: 59.35%:
(Go To: Top: General Summary: Monthly Report: Daily Summary: Hourly Summary: Domain Report: Organisation Report: Search Word Report: Operating System Report: Status Code Report: File Size Report: File Type Report: Directory Report: Request Report)
This report lists the extensions of requested files.
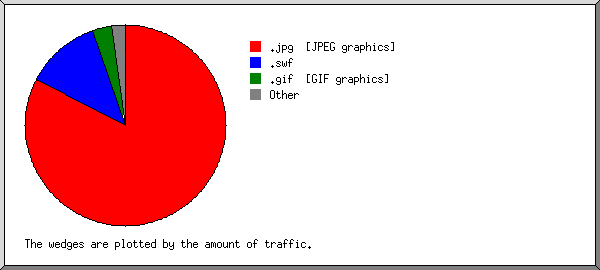
Listing extensions with at least 0.1% of the traffic, sorted by the amount of traffic.
reqs: %bytes: extension
----: ------: ---------
 219: 82.59%: .jpg  [JPEG graphics]
  12: 12.21%: .swf
  26:  3.07%: .gif  [GIF graphics]
  25:  0.95%: .html [Hypertext Markup Language]
  22:  0.56%: [directories]
  12:  0.43%: .cgi  [CGI scripts]
  19:  0.12%: .css  [Cascading Style Sheets]
   2:  0.07%: [not listed: 1 extension]
(Go To: Top: General Summary: Monthly Report: Daily Summary: Hourly Summary: Domain Report: Organisation Report: Search Word Report: Operating System Report: Status Code Report: File Size Report: File Type Report: Directory Report: Request Report)
This report lists the directories from which files were requested. (The figures for each directory include all of its subdirectories.)
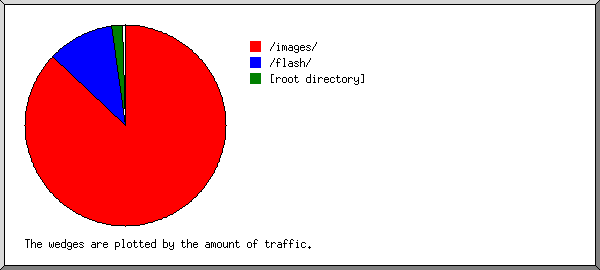
Listing directories with at least 0.01% of the traffic, sorted by the amount of traffic.
reqs: %bytes: directory
----: ------: ---------
 247: 87.07%: /images/
  11: 10.81%: /flash/
  66:  1.65%: [root directory]
  12:  0.43%: /cgi-sys/
   1:  0.04%: http://
(Go To: Top: General Summary: Monthly Report: Daily Summary: Hourly Summary: Domain Report: Organisation Report: Search Word Report: Operating System Report: Status Code Report: File Size Report: File Type Report: Directory Report: Request Report)
This report lists the files on the site.

Listing files with at least 20 requests, sorted by the number of requests.
reqs: %bytes:       last time: file
----: ------: ---------------: ----
  20:  0.51%: 20/Jan/03 20:19: /
 317: 99.49%: 20/Jan/03 21:41: [not listed: 117 files]
(Go To: Top: General Summary: Monthly Report: Daily Summary: Hourly Summary: Domain Report: Organisation Report: Search Word Report: Operating System Report: Status Code Report: File Size Report: File Type Report: Directory Report: Request Report)

